Master Your Annual Report: The Ultimate PowerPoint Presentation
An annual report is more than just a stack of financial tables and dense text; it is a narrative of your company’s journey over the past twelve months. It serves as a vital communication tool designed to inform shareholders, stakeholders, and the public about your corporate activities and financial performance. However, compiling this information into a document that is both engaging and professional is a significant challenge for many entrepreneurs and small business owners. This is where the Annual Report PowerPoint Presentation template becomes an indispensable design asset. It bridges the gap between raw data and compelling storytelling, ensuring that your corporate narrative is presented with the clarity and polish of a Fortune 500 company.
A Visual Identity Built for Clarity
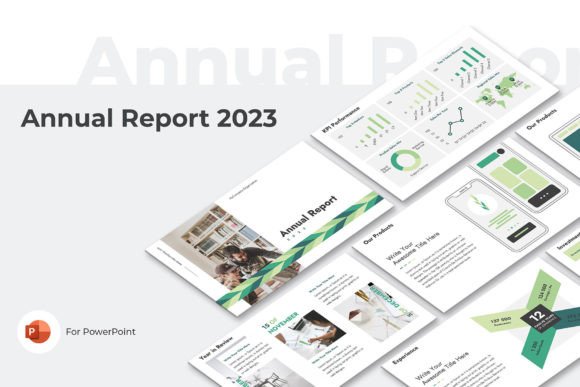
The visual personality of this presentation template is defined by sophistication and neutrality. It does not scream for attention with garish colors or distracting animations; instead, it commands respect through a clean, structured layout. The aesthetic relies heavily on modern typography principles, utilizing a balance of sans serif and serif typefaces to create a clear visual hierarchy. This approach ensures that headlines grab attention while body text remains highly readable, a critical factor when presenting complex financial highlights or detailed KPIs. The overall appeal is one of organized competence. It creates a sense of trust immediately upon opening the file, which is essential for maintaining the confidence of investors and partners.
One of the standout features of this template is its adaptability through three pre-made color themes: Blue, Green, and Red. These are not arbitrary choices. Blue is often associated with corporate stability and trust—perfect for financial institutions or tech firms. Green suggests growth, sustainability, and health, making it ideal for eco-friendly brands or agricultural businesses. Red evokes energy, passion, and urgency, suitable for dynamic startups or retail giants looking to highlight aggressive expansion. By offering these variations, the template allows you to align the brand identity of the report with the specific message you wish to convey this year. The 16:9 (1920x1080) screen size is the industry standard for widescreen displays, ensuring that your presentation looks crisp on projectors, monitors, and even when shared as a digital PDF.
Strategic Applications Beyond the Year-End
While the primary function is the Year Report, the structure of this PowerPoint file makes it a versatile tool for various business needs. If you are a content creator or marketer, you can repurpose the slides for a comprehensive Company Profile. The pre-designed sections for "Vision and Mission" and "Regional Presence" are already optimized for storytelling, saving you hours of layout work. Instead of starting from a blank canvas, you are working within a framework that has been designed by professionals to guide the viewer’s eye from the company overview to the specific financial data.
For entrepreneurs and small business owners, the template serves as a powerful pitch deck foundation. Imagine walking into a meeting with potential investors. Instead of fumbling with inconsistent slide designs, you present a cohesive deck that covers your team, your market reach, and your financial highlights. The inclusion of specific slides for KPIs (Key Performance Indicators) allows you to translate complex metrics into digestible visual chunks. This is crucial for audience engagement; investors do not want to read a wall of text. They want to see the trajectory of your success visualized effectively. The template essentially acts as a premium font for your business strategy—giving your ideas the professional "voice" they deserve.
Practical Guidance for Customization
When you download the Annual Report PowerPoint Presentation, you receive three PPTX files and a User Guide PDF. To get the most out of these design assets, you need to approach customization with a strategic mindset. First, evaluate the font pairing included in the template. The designers have likely paired a bold, geometric sans serif for headers with a legible serif or sans serif for body text. If you choose to change the fonts to match your existing brand guidelines, ensure you maintain this contrast. A common mistake in editorial design is using two fonts that are too similar, which creates visual confusion rather than hierarchy.
Next, consider the photography. The template notes that demo photos are for preview only. This is where your own high-quality imagery comes in. The layout is designed to accommodate professional photography, so avoid using low-resolution stock images. Whether you are showcasing your team or your products, the images should be cropped to fit the placeholders perfectly. This attention to detail is what separates amateur presentations from professional web design and print materials. If you are using the report for social media graphics, you can extract individual slides—such as a specific KPI chart or a "Meet the Team" slide—and export them as images. This creates a cohesive look across your digital platforms, reinforcing your brand identity.
Ensuring Readability and Professionalism
Readability is the cornerstone of effective communication. When editing the text on the slides, be ruthless in your editing. Bullet points should be concise. If a slide feels crowded, it is usually because there is too much text, not because the design is flawed. Use the "Regional Presence" slide to highlight key markets rather than listing every single zip code you operate in. The goal is to spark a conversation, not to provide an exhaustive encyclopedia entry.
Furthermore, take advantage of the template’s structure to build a consistent visual narrative. Consistency in modern typography and color usage builds recognition. When a stakeholder flips through the pages, the consistent use of the Blue, Green, or Red theme should feel like a signature. This consistency extends to how you handle data. Use the charts and graphs provided to visualize your financial highlights. A well-designed chart is worth a thousand words of financial jargon. It allows the viewer to instantly grasp trends, making the data accessible to both the CFO and a layperson interested in your company's performance.
Ultimately, the Annual Report PowerPoint Presentation is more than just a collection of slides; it is a framework for success. It empowers designers, bloggers, and publishers to produce high-stakes documents without needing a background in graphic design. By leveraging the pre-made layouts and focusing on high-quality content, you can transform a mundane corporate obligation into a powerful tool for engagement and growth. Whether you are crafting a year-end summary or a comprehensive company profile, this template provides the commercial font